Desmos Art Portfolio
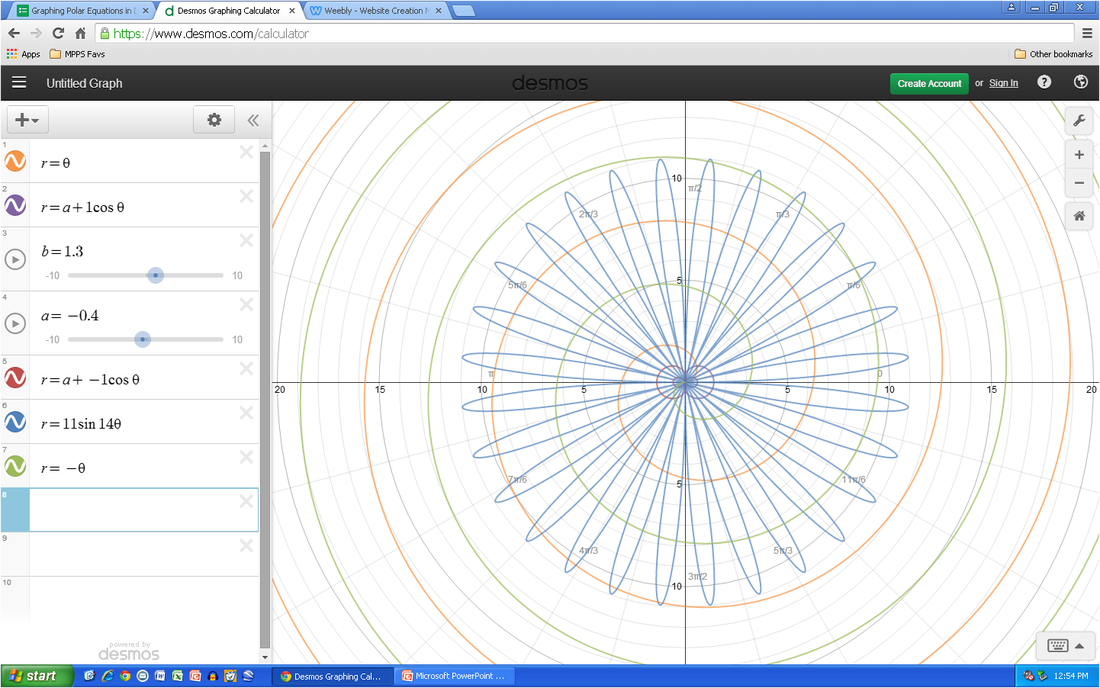
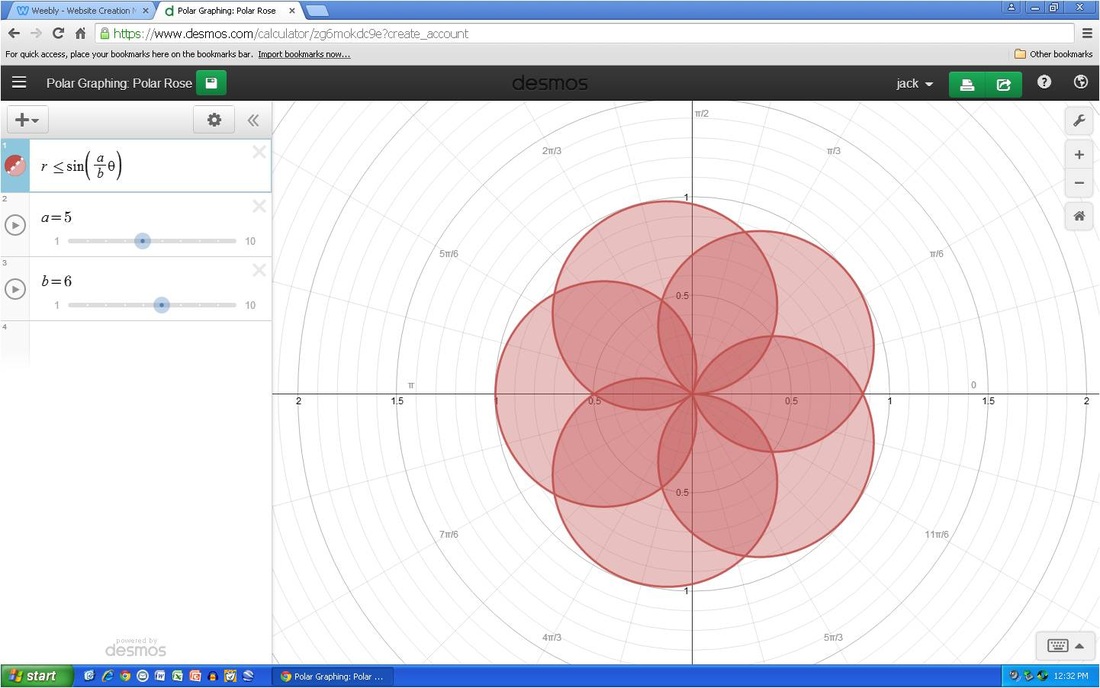
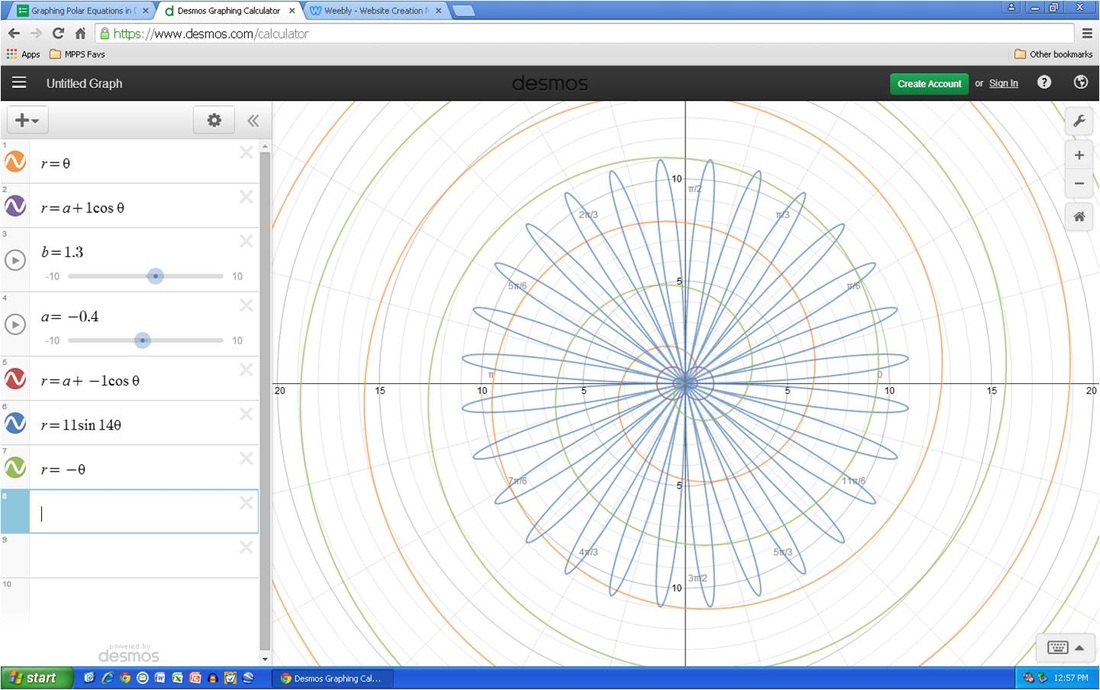
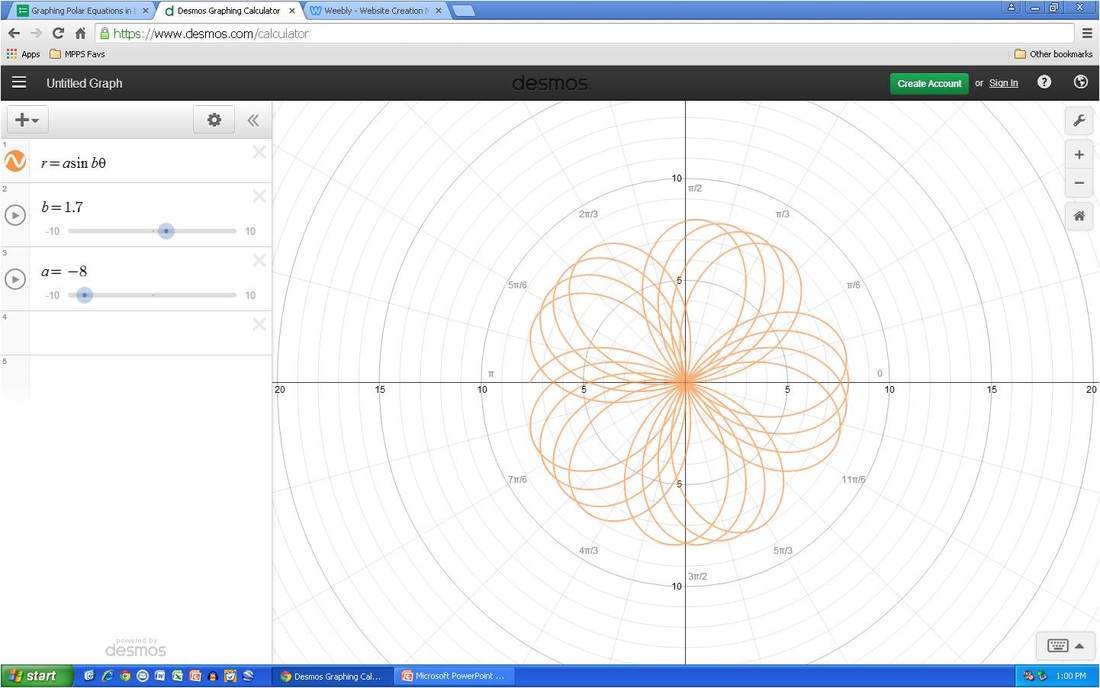
In each of these graphs their is a use of different mathematics equations that create interesting pictures that some could define as art and others define as boring. For the top left graph it starts of as R=theta which gives it the swirls, next their is r=a+1costheta which gives the graphs the the small circles at the center of the graph, and last for the this graph their is the equation r=11sin14theta which gives the graph the flower circling around it. For the top right graph the equation used is r=asinbtheta, with the b=1.7 and the a=-8 it gives the graph the spiraling circles that overlap each other to make a big flower. For the final graph at the bottom it uses the equation r is <= sin(a/btheta) with a=5 and b=6 being multiplied by sin creates a group of circles around the center axis that when come together and shaded form a flower within the circles from the equation. At the beginning of the trimester the art that we were making on desmos was simple lines like cos and sin that would make waves. As the trimester progressed we learned how to create waves that could go in certain direction and had the ability to go on different angles. We were taught various equations and formulas that would expand our knowledge and give us the ability to to create more creative art graphs on desmos which led us to being able to create the beautiful graphs you see on this assignment.
In each of these graphs their is a use of different mathematics equations that create interesting pictures that some could define as art and others define as boring. For the top left graph it starts of as R=theta which gives it the swirls, next their is r=a+1costheta which gives the graphs the the small circles at the center of the graph, and last for the this graph their is the equation r=11sin14theta which gives the graph the flower circling around it. For the top right graph the equation used is r=asinbtheta, with the b=1.7 and the a=-8 it gives the graph the spiraling circles that overlap each other to make a big flower. For the final graph at the bottom it uses the equation r is <= sin(a/btheta) with a=5 and b=6 being multiplied by sin creates a group of circles around the center axis that when come together and shaded form a flower within the circles from the equation. At the beginning of the trimester the art that we were making on desmos was simple lines like cos and sin that would make waves. As the trimester progressed we learned how to create waves that could go in certain direction and had the ability to go on different angles. We were taught various equations and formulas that would expand our knowledge and give us the ability to to create more creative art graphs on desmos which led us to being able to create the beautiful graphs you see on this assignment.
 |  |
 RSS Feed
