|
1: Exponential function 2:y=1.8^(x-3.5) 3: 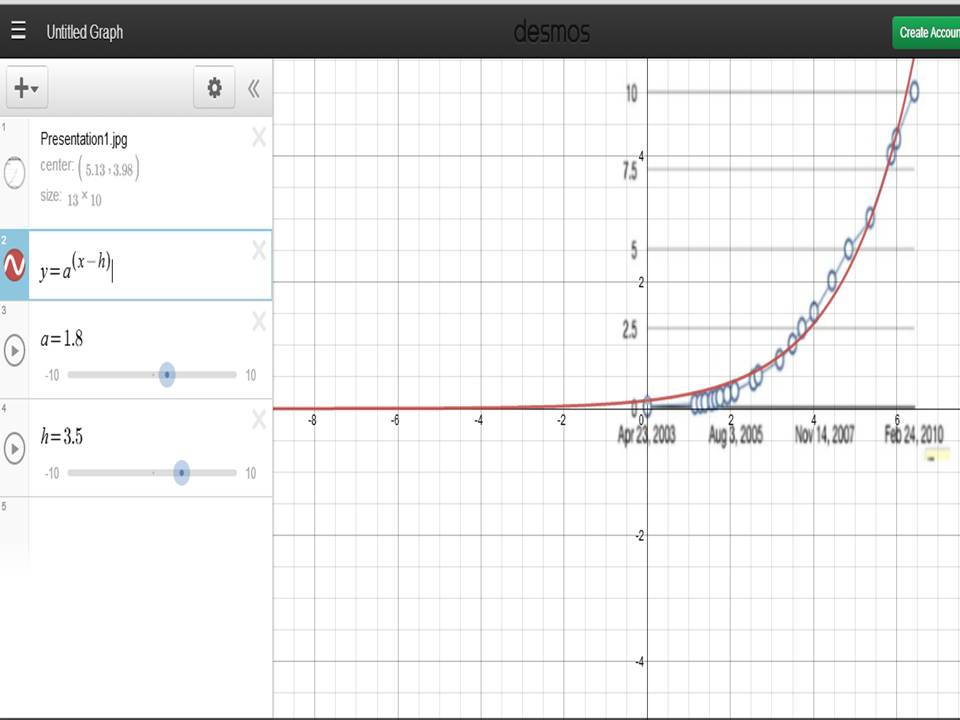
4:Infinity (all real #'s)
5: All #'s greater than zero (no negative points) 6: The line will continue to increase exponentially as new and exciting products will be released by apple 7:This information leads me to believe that the range could fall into the negative and and the domain would not continue to increase as expected. You cannot extend this information for longer periods of time because the graph cannot always be predicted correctly. 1: What do you have to know to put the equation together for the basketball? The points of the basketball during its flight, a line of best fit to follow the basketballs pattern of flight 2: Will the basketball go in? Yes as seen below on the line of best fit 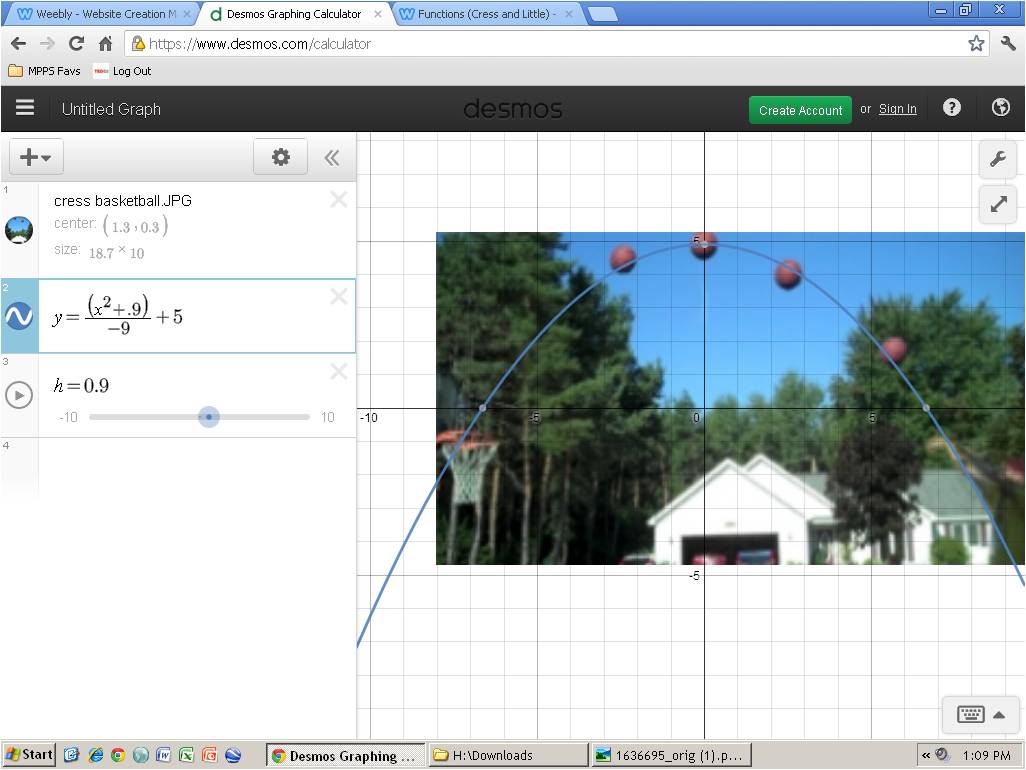
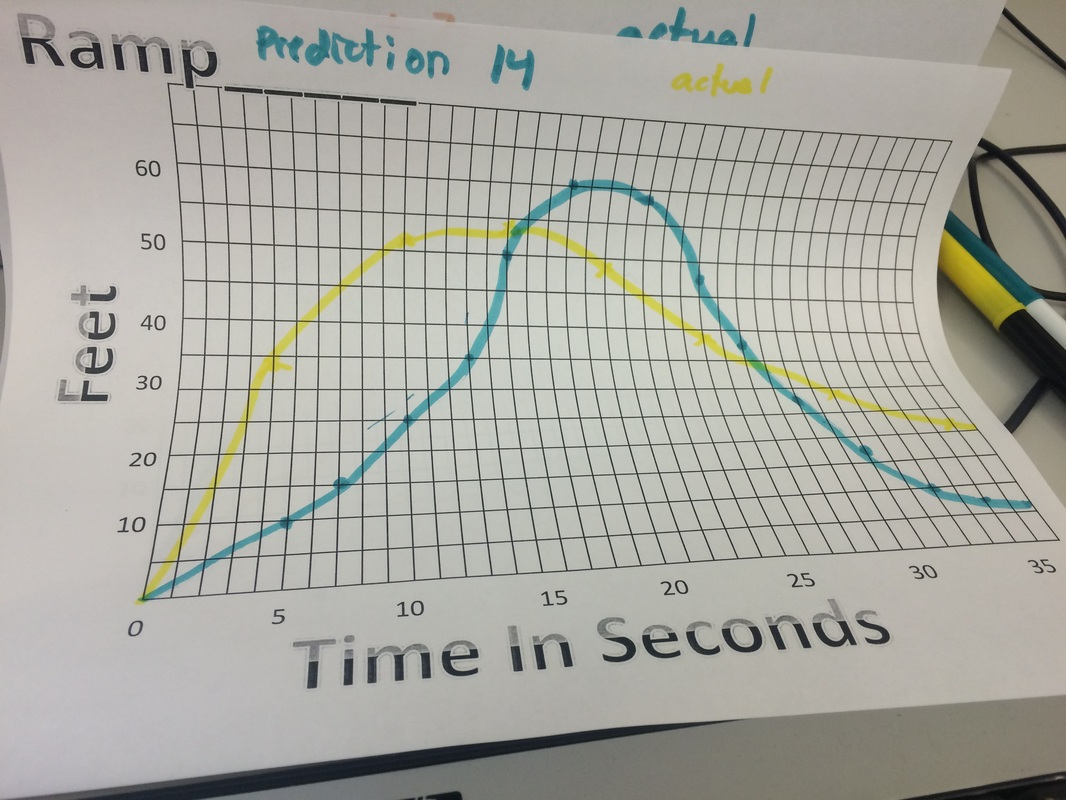
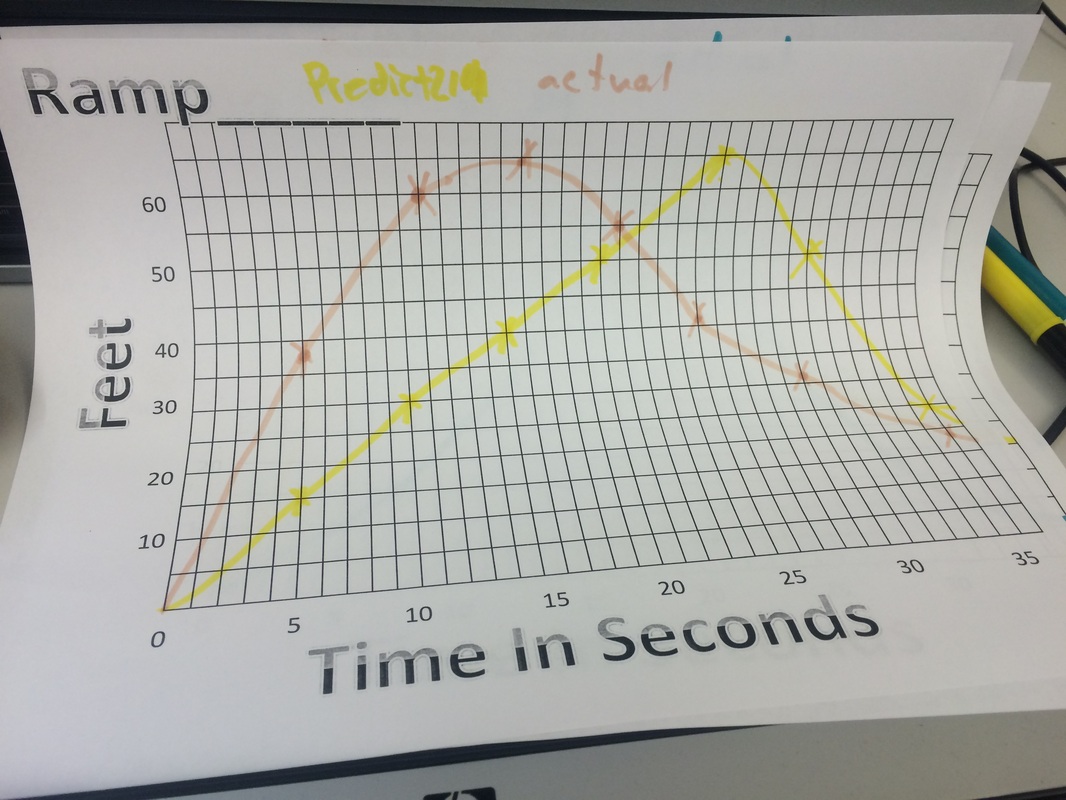
A. In the skateboard Activity 1 of 3 of my predictions was fairly close to its actual graph, the 2 graphs that were different were my predictions for 21 and 14 and this was because i thought 21 would reach its high point later in its rolling and 14 would be a fast climb to a slow descent. I thought 21 would build up speed slower because of its larger drop and 14 would climb faster because it had a medium sized drop that was not to steep of fall. B. The zeros represent when the skateboard is at the top of the ramp C. The graphs go down in Size of zeros as you go down in number size, it is revealed by the video that the higher the zero the bigger the maximum and the lower the zero the lower the minimum. 21 and 14 were built up pretty fast because of their higher zeros, 7 had the same buildup but its decrease in speed was basically non-existent due to the fact it stopped D. When the graph is rising and falling the fastest it is when the skateboard is traveling at its top speed either form the ramp or the slow decline in the hill it went up. E. 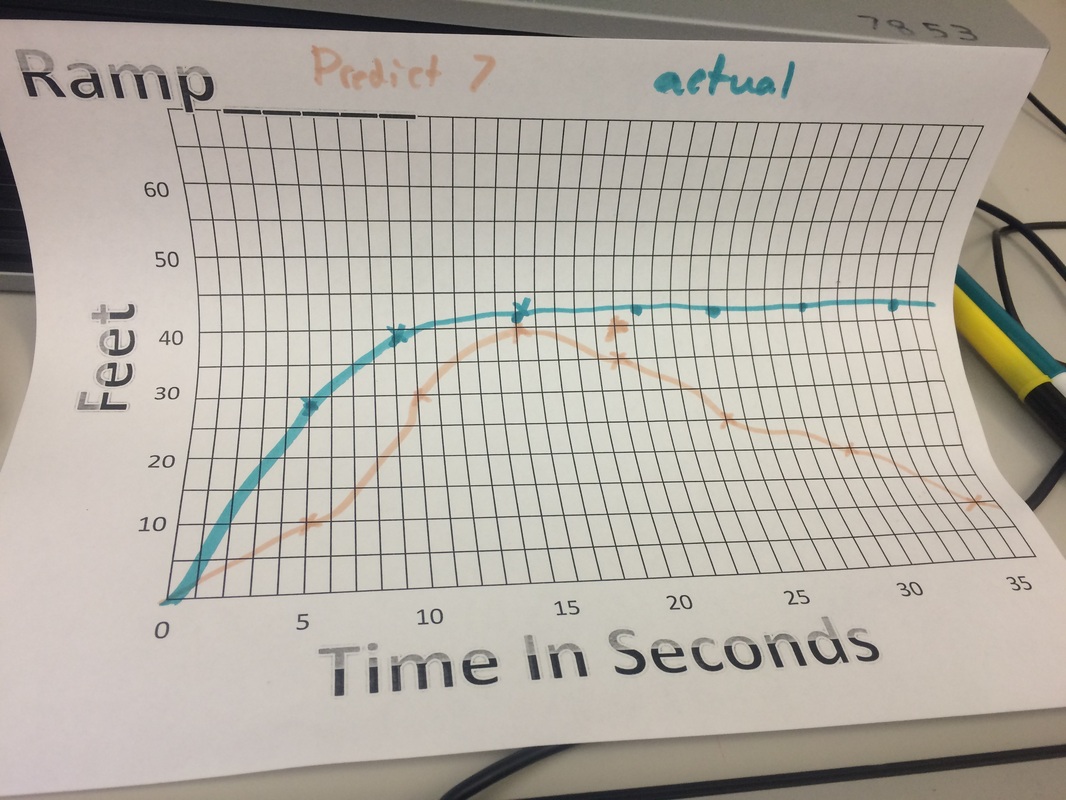
1. A: The boy is raising the flag at a consistent rate in which he does not speed up or slow down at any point
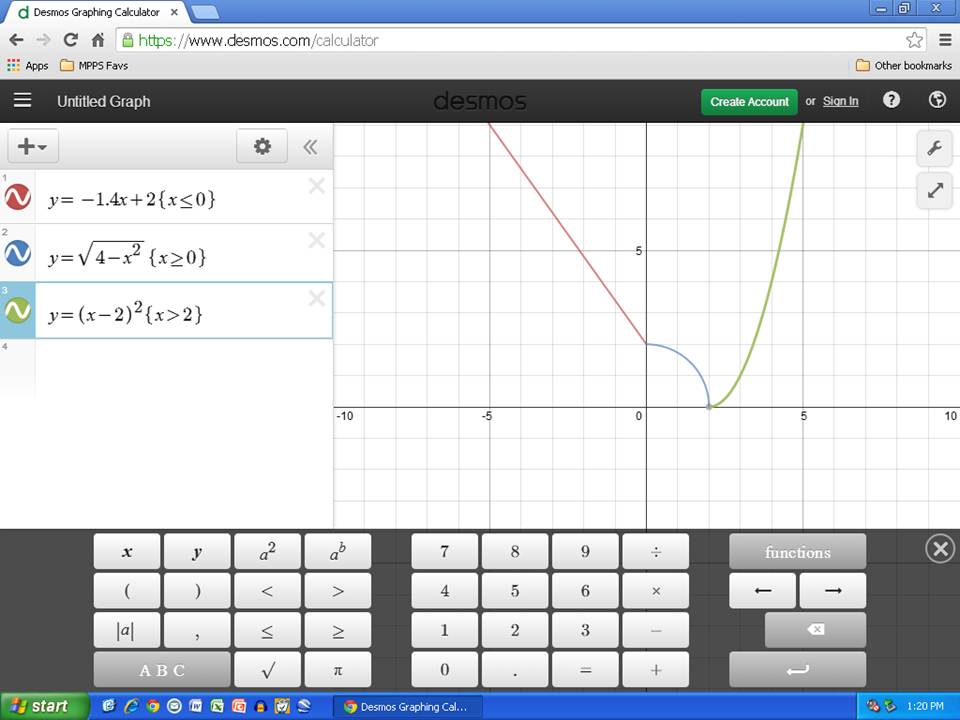
B: The flag is raised very quickly at the beginning of its raising but when it reaches 75% of full height it raise is slowed C: The flag is inconsistently raised go from very fast to very slow constantly D: The flag is slowly raised to begin with until around the 60% raised status then it is immediately raised for what is left of the pole E: The flag is slowly raised to being with then immediately raised from 20-70% then slowly raised from there to the very top F: The flag at one point is very quickly raised to the top 2. The most realistic graph is A because the one raising the flag is going at a steady pace and does not stop or speed up 3. The most unrealistic graph would be graph F due to its immediate raise in the span of one single moment 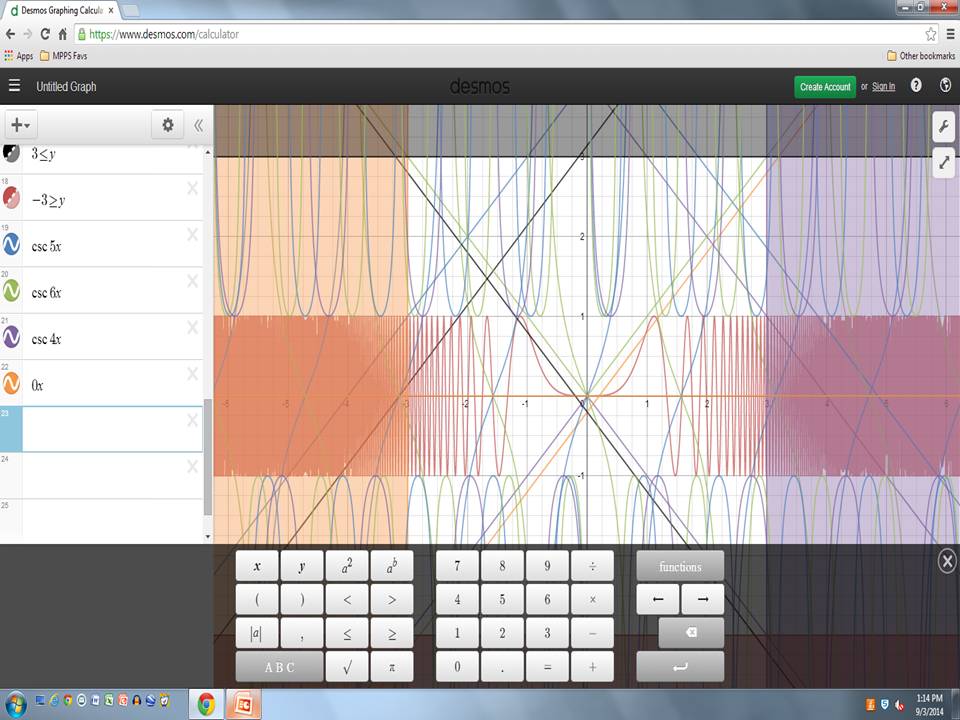 this is a picture it used socahtoa, cosecant, y=mx+b, and absolute value of equation
|
Quote of the MomentYou can't go balls to the wall unless your willing hit your balls on the wall Archives
March 2015
Categories |
 RSS Feed
