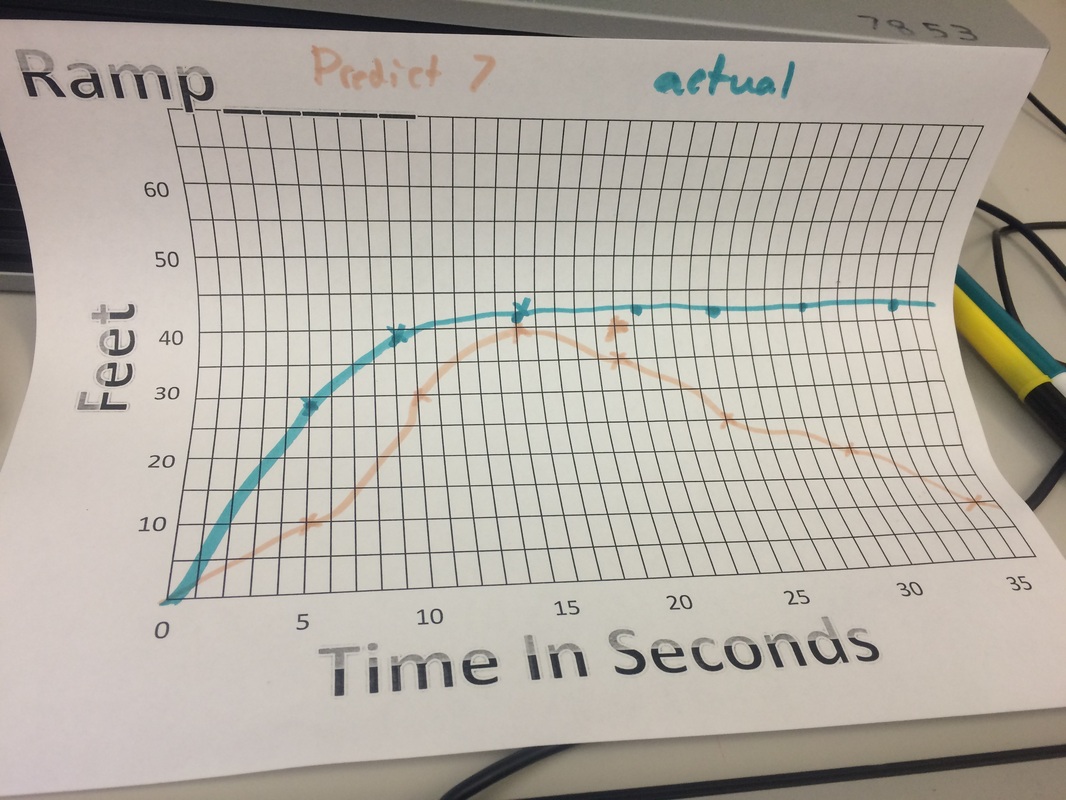
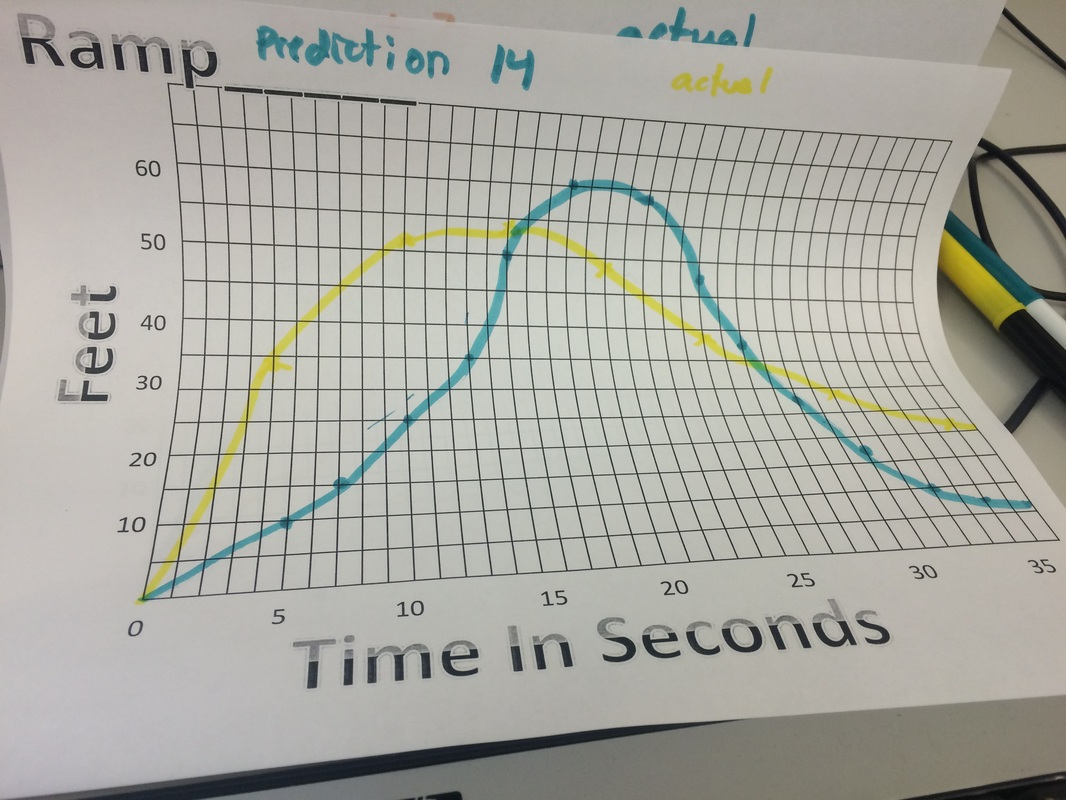
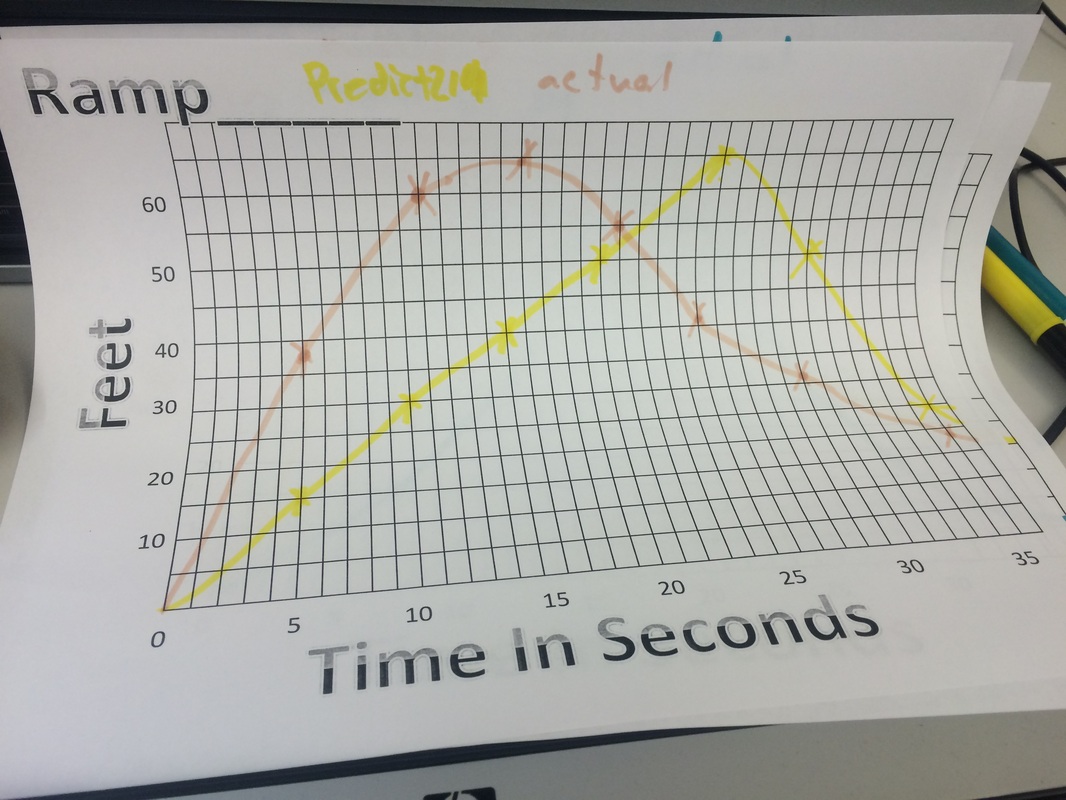
A. In the skateboard Activity 1 of 3 of my predictions was fairly close to its actual graph, the 2 graphs that were different were my predictions for 21 and 14 and this was because i thought 21 would reach its high point later in its rolling and 14 would be a fast climb to a slow descent. I thought 21 would build up speed slower because of its larger drop and 14 would climb faster because it had a medium sized drop that was not to steep of fall.
B. The zeros represent when the skateboard is at the top of the ramp
C. The graphs go down in Size of zeros as you go down in number size, it is revealed by the video that the higher the zero the bigger the maximum and the lower the zero the lower the minimum. 21 and 14 were built up pretty fast because of their higher zeros, 7 had the same buildup but its decrease in speed was basically non-existent due to the fact it stopped
D. When the graph is rising and falling the fastest it is when the skateboard is traveling at its top speed either form the ramp or the slow decline in the hill it went up.
E.
 RSS Feed
